
The Gold Rally - Daniele Panio
In the current macroeconomic environment; characterized by elevated inflation uncertainty and real rate expectations shifting, gold has emerged as a strategic asset within diversified portfolios.
Investors generally buy gold as a way of diversifying risk in their investment portfolios, especially using futures contracts, derivatives and ETFs.
Like other commodities, the gold market is subject to speculation and volatility.In recent days, increasing attention has been paid on the commodity rally (especially gold and silver), and many retail investors are getting interested in the matter. Therefore, in order to avoid common misconceptions,it is important to clarify the economic role of gold and the function of these assets in investment portfolios.
A Unique Asset
Gold is a unique asset: it doesn’t pay any interest, and it is not a productive asset.
Nevertheless, for over 5,000 years, gold has played a central role in economic systems as a medium of exchange and a store of value.Its demand is primarily driven by jewelry and as investment and last but not least as a store of value for central banks.
However, its critical points are:
- opportunity cost
- high volatility
- long underwater periods
Gold and Real Interest Rates: a regime-dependent relationship
Gold’s inverse correlation with the Federal Reserve’s real interest rates is a key feature of this asset.
The inverse relationship between gold and real interest rates is not constant but becomes significantly stronger during periods of negative real yields.
When interest rates are reduced, investors may decide to allocate higher concentrations of gold in their portfolio because declining real yields reduce the opportunity cost of holding non-yielding assets such as gold.
Conversely, when interest rates rise, investors historically reduced gold allocation, because they prefer higher cashflows from bonds market.However, gold’s behaviour is far from perfectly predictable, gold exhibits regime-dependent dynamics that make short-term speculative positioning particularly risky.
To prove the inverse correlation between US Dollar and Gold, imported monthly data from investing.com for the past 20 years and I found out (self/computed) that the Pearson's correlation coefficient was –0,46 from 2006-2026. Reflecting the predictable behavior of both gold and dollars.
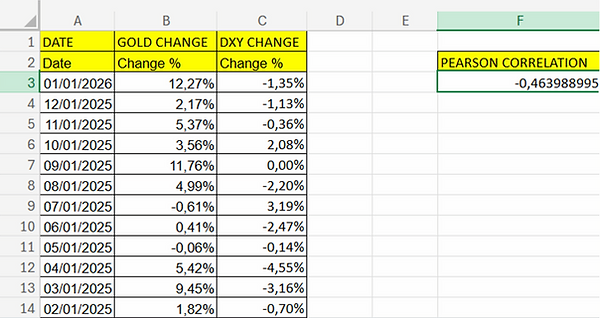
So we can state that gold can act as a currency hedge asset due to its nature and correlation coefficient.
Gold is also related with geopolitical tension, the impact is not as easily predictive as inflation, US Dollar performance and demand, this drives prices differently than what is expected, due to unpredictable high stress situations.
Although gold prices did not immediately explode, the rally can be traced back to 2018, when the macroeconomic regime began to change and shift direction.

During this period, US real interest rates stopped rising, the US Dollar lost momentum, and monetary policy started to weaken.
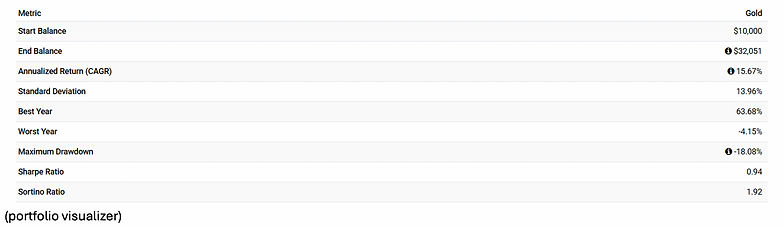
Rather than marking a speculative breakout, 2018 may represent the beginning of an accumulation phase, which later evolved into a full-scale rally with an astonishing CAGR of 15,67%.
The rally and subsequent drawdown observed over the last month perfectly illustrate gold’s regime-dependent nature.
When real rate expectations decline, gold benefits even in the absence of immediate policy changes.
Conversely, sudden shifts toward tighter monetary expectations tend to trigger short-term corrections,without necessarily invalidating the broader strategic role of gold in diversified portfolios.

Gold reacts to where real rates are expected to go, not where they currently are.
The drawdown was not a failure of gold as an asset, but it was a rational correction following a shift in real rate expectations due to last news.On January 30th, gold experienced an intraday drawdown of approximately −12.6% passing from about 5600/oz to about 4850/oz.
This was caused by a sharp upward adjustment in real interest rate expectations and interest rate’s repricing strengthen US Dollar, reflecting a swift decrease.
These drawdowns are consistent with historical episodes of gold correcting after extended rallies.
Therefore, they do not invalidate gold’s strategic role over longer time horizons.
That’s why we need to take a look at the big picture.The drawdown did not invalidate gold’s long-term role.Knowing the historical macrotrend of gold is useful to understand its behaviour in the long term.
However, many investors when approaching graphs are not considering historical performance, but they only check recent years.
This leads to recency bias when evaluating portfolios; because you can get tricked by recent performance without knowing the big picture, here’s a quick example:
Here are the metrics and the analysis of performance.
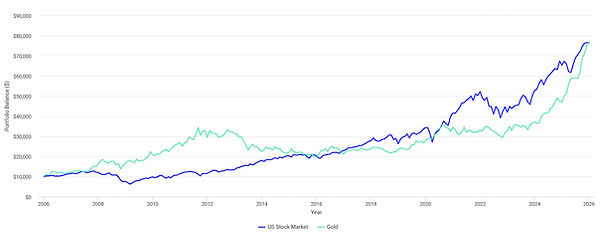
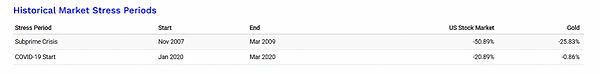
We can state that in the past 20 years, gold and stocks had almost “same” results in CAGR.
But the behaviour of assets changed a lot during high stress scenarios, where gold resisted better.
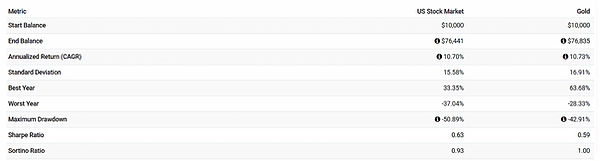
Comparing Gold vs Stocks vs 10y Treasury from 1971-2026:
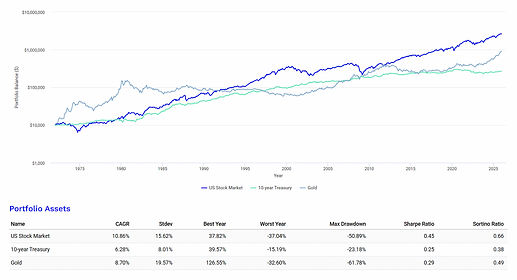
Here are represented the metrics of these 3 investments:
- Us stock market: outperformed on a risk-adjusted basis is characterised by the highest CAGR of the three assets: 10,86%, with a standard deviation of 15,62%.
- 10-years treasury: had the lower growth, with a decent CAGR of 6,28%, but the lowest possible standard deviation of 8,01%.
- Gold: the most volatile of the 3, with a CAGR of 8,70% and standard deviation 19,57%.
Some history about Gold: The Gold Standard
The Bretton Woods system of monetary management established the rules for commercial relations among 44 countries, including the United States, Canada, Western European countries, and Australia, after the 1944 Bretton Woods Agreement until the Jamaica Accords in 1976.
The Bretton Woods system was the first example of a fully negotiated monetary order intended to govern monetary relations among independent states. The Bretton Woods system required countries to guarantee convertibility of their currencies into U.S. dollars with the dollar convertible to gold bullion for foreign governments and central banks.It established that the US Dollar was convertible into gold with a fixed standard (35 dollars =1 Oz of gold or 31,1g).
This fixed standard is known as “gold exchange standard”, and it was introduced in 1944.
When this system collapsed, gold started to behave as a financial asset, and its price was moving along the financial laws.
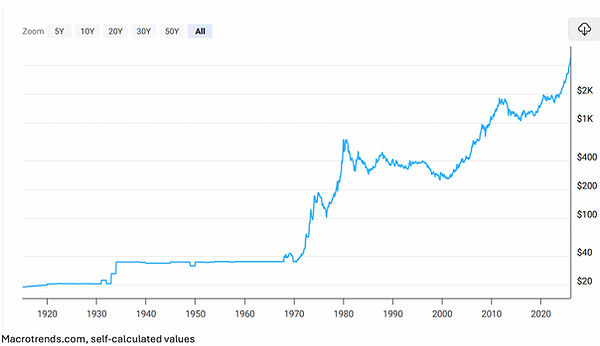
The above graph shows the growth of gold in the past century.
We can notice 4 different macrotrends:
1. The first period was characterized by the stagnation of the value. This is due to the Bretton woods system, in which the value of gold and value of dollar were aligned and constant.Practically, this means we have only 55 years of data.
2. 1971-1980 +1673% (33,2% CAGR). In August 1971, U.S. President Richard Nixon ended the convertibility of the U.S. dollar into gold, effectively removing the Bretton Woods system that had kept gold priced at $35 per ounce for the first period until 1971. With this link removed, gold began trading freely on global markets, and its price was no longer fixed by governments, instead responding to supply and demand, inflation, and geopolitical risk, like any other financial asset.
3. 1980-2000-59,8% (-4,5% CAGR)From 1980 to 2000, gold experienced a huge reversal compared to the aggressive rally of the 1970s. It went from its peak in early 1980 to a prolonged period of stagnation and decline.
- January 1980: Gold reached an all-time nominal high of ~$850/oz due to high inflation, geopolitical tensions (Iran hostage crisis), and the lingering effects of the 1970s oil shocks.
- Shortly after, U.S. inflation began to be tamed by Fed Chairman Paul Volcker’s aggressive interest rate hikes, which caused real interest rates to rise.As we previously mentioned, gold price depends now also on US interest rates, geopolitical tension, inflation; pushing the price down as the increase of interest rates began. High real interest rates reduce the appeal of non-yielding assets like gold, leading to a price decline, making bonds more appealing.
4. 2000-2025+846%, (+9,8% CAGR)From 2000 to 2025, gold experienced a major bull market, followed by periods of consolidation, reflecting a very different environment than the 1980–2000 bear market.
The main reasons that led this growth are:
- Weakening of US Dollar
- Low real interest rates
- Geopolitical tensions (Iraq War, 9/11)
- Rising demand from emerging markets (China, India)
Of course, gold is also characterized by high volatility, reflecting many changes in prices during these past 55 years.
IMPLEMENTATION OF GOLD PORTFOLIO EXAMPLE: THE GOLDEN BUTTERFLY
Here’s a backtest analysis of one of the main examples of gold implementation in retail investment portfolios, The Golden Butterfly.
The golden butterfly is a medium-risk portfolio based on 5 exchange-traded fund.
This is a clear example of efficiency and diversification.
The portfolio is composed by:
-20% Us Stocks (for europeans, maybe it is better using a world index stocks)
-20% Small cap value stocks
-20% Short term treasury (again, for europeans, maybe it’s better using europeans’ due to tax efficiency and EUR hedging)
-20% Gold (gold historically provides diversification benefits)
-20% long-term Treasury
To have a clear idea about diversification and efficiency impact on investment portfolios, I confronted this portfolio with 100% US stocks (which performed brilliantly in the past years) and 100% Gold.
A smart mix of 3 asset classes, diversified can give better results and lower volatility than pure strategy.
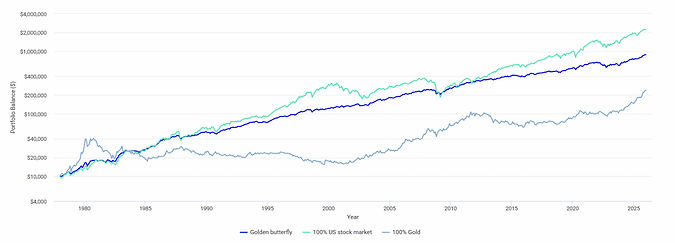
100% US stock portfolio, regarding performance beat the other 2 generated portfolios, from 1977-2026.
But let’s check the metrics and see how they performed and how they reacted to high stress market situations.
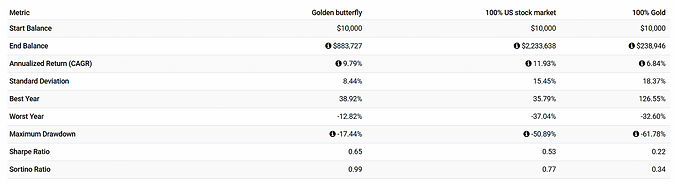
It is true that 100% US stock market performed way better in terms of pure CAGR performance, but golden butterfly’s Maximum drawdowns and Sharpe ratios are way more balanced, resisting high stress scenarios and having a more sustainable growth during portfolio’s life.
MAXIMUM UNDERWATER PERIOD FOR GOLDEN BUTTERFLY PORTFOLIO:
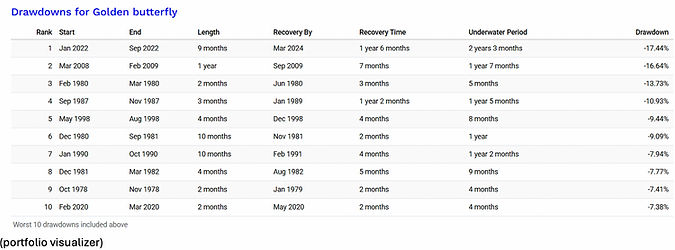
Unlike 100% gold, which pure strategy had the highest time possible underwater, golden butterfly, including the same period had a maximum underwater period of only about 2 years and 3 months.
MAXIMUM UNDERWATER PERIOD FOR 100% US STOCKS:
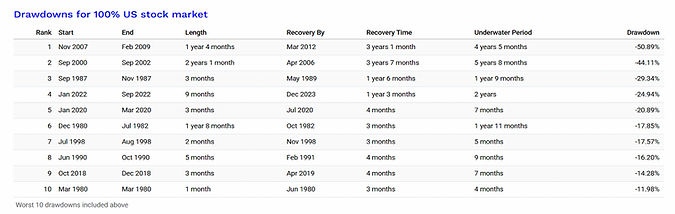
100% US stocks portfolio had quick recovers, but much heavier drawdowns, so it is important noticing that, when choosing a 100% stocks allocation, you must be prepared for heavy drawdowns.
MAXIMUM UNDERWATER PERIOD FOR 100% GOLD:
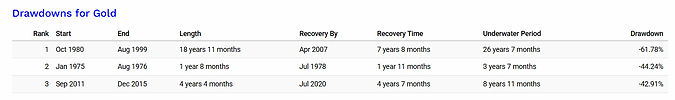
The graph above shows the 3 biggest and most relevant drawdowns of gold.
- Oct 1980-Aug 1999
The most astonishing trait is the underwater period:
- Jan 1975-Aug 1976 The drawdown was dramatical, but quick, with high volatility and a max drawdown of –44,24%, underwater period 3y and 7m
- Sep 2011-Dec 2015
8 years and 11 months underwater, max drawdown –42,91%
CONCLUSION
Gold should be viewed as a strategic hedge whose primary function is portfolio diversification in macroeconomic regimes.
Periods of economic and geopolitical stress makes it highly regime dependent.In contrast, stocks have historically gained superior long-term returns.
But, gold has consistently demonstrated its value during high-stress environments, protecting investors against inflationary, geopolitical shocks and monetary instability.
However, gold experienced extended underwater periods and elevated volatility, implying a significant opportunity cost.
Gold is most effective when integrated in a diversified portfolio rather than pursued as a short-term speculation.
Some allocation, such as Golden Butterfly portfolio, demonstrates how combining growth assets with defensive and inflation-hedging components can improve risk-adjusted returns and reduce drawdowns, yielding a better Sharpe ratio.
Retail investors should therefore prioritize their goals over short-term gains, avoiding emotional decisions driven by market FOMO or recent performance.